Multi-Length RSI **Multi-Length RSI Indicator**
This script creates a custom Relative Strength Index (RSI) indicator with the ability to plot three different RSI lengths on the same chart, allowing traders to analyze momentum across various timeframes simultaneously. The script also includes features to enhance visual clarity and usability.
**Key Features:**
1. **Customizable RSI Lengths:**
- The script allows you to input and customize three different RSI lengths (7, 14, and 28 by default) via user inputs. This flexibility enables you to track short-term, medium-term, and long-term momentum in the market.
2. **Dynamic Colour Coding:**
- The RSI lines are color-coded based on their current value:
- **Above 70 (Overbought)**: The line turns red.
- **Below 30 (Oversold)**: The line turns green.
- **Between 30 and 70**: The line retains its user-defined colour (blue, yellow, orange by default).
- This dynamic colouring helps to quickly identify overbought and oversold conditions.
3. **Adjustable Line Widths and Colours:**
- Users can customize the colour and thickness of each RSI line, allowing for a personalized visual experience that fits different trading strategies.
4. **Overbought, Oversold, and Midline Levels:**
- The script includes static horizontal lines at the 70 (Overbought) and 30 (Oversold) levels, with a red and green colour, respectively.
- A midline at the 50 level is also included in gray and dashed, helping to visualize the neutral zone.
5. **Dynamic RSI Value Labels:**
- The current values of each RSI line are displayed directly on the chart as labels at the most recent bar, with colours matching their corresponding lines. This feature provides an immediate reference to the exact RSI values without the need to hover or look at the data window.
6. **Alerts for Crosses:**
- The script includes built-in alert conditions for when any of the RSI values cross above the overbought level (70) or below the oversold level (30). These alerts can be configured to notify you in real-time when significant momentum shifts occur.
**How to Use:**
1. **Customization**:
- Input your preferred RSI lengths, colours, and line widths through the script’s settings menu.
2. **Visual Analysis**:
- The indicator plots all three RSI values on a separate pane below the price chart. Use the color-coded lines and levels to quickly identify overbought, oversold, and neutral conditions across multiple timeframes.
3. **Set Alerts**:
- You can configure alerts based on the built-in alert conditions to get notified when the RSI crosses critical levels.
**Ideal For:**
- **Traders looking to analyze momentum across multiple timeframes**: The ability to view short-term, medium-term, and long-term RSIs simultaneously offers a comprehensive view of market strength.
- **Those who prefer visual clarity**: The dynamic colouring, clear labels, and customizable settings make it easy to interpret RSI data at a glance.
- **Traders who rely on alerts**: The built-in alert system allows for proactive trading based on significant RSI level crossings.
---
This script is a powerful tool for any trader looking to leverage RSI analysis across multiple timeframes, offering both customization and clarity in a single indicator.
Cerca negli script per "relative strength"
Korneev Reverse RSIRethinking the Legendary Relative Strength Index by John Welles Wilder
The essence of the new approach lies in the reverse use of the so-called "overbought" and "oversold" zones. In his 1978 book, "New Concepts in Technical Trading Systems," where the RSI mechanism was thoroughly described, Wilder writes that one way to use the oscillator is to open a long position when the RSI drops into oversold territory (below 30) and to open a short position when the RSI rises to overbought levels (above 70). However, backtesting this strategy with such inputs yields rather mediocre results.
Based on the calculation formula, the RSI calculates the rate of price change over a certain period. Therefore, overbought and oversold zones will have relative significance (relative to the set calculation period). It is no coincidence that the word "relative" was added to the name of the oscillator. It is worth accepting as an axiom the assertion that the price of an asset is fair at every moment in time.
Essentially, the RSI calculates the strength of a trend. If the oscillator value is above 70, it is highly likely that an upward movement is occurring in the market. Therefore, in the current strategy, a long position is opened precisely at the moment of greatest buyer strength (when RSI > 80), i.e., in the direction of the trend, since counter-trend trading with the RSI has proven to be ineffective. The position is closed after the buyers lose their advantage and the RSI drops to 40.
The strategy is recommended to be used only with long positions, as short positions show negative results. The strategy uses a moving average for the RSI with a period of 14 to smooth the oscillator data.
--------------------------------------------------------------------------------------------
Переосмысление легендарного осциллятора Relative strength index Джона Уэллса Уайлдера
Суть нового подхода заключается в реверсивном использовании так называемых зон "перекупленности" и "перепроданности". В своей книге от 1978 года "New concepts in tecnical trading systems", в которой был подробно описан механизм работы RSI, Уайлдер пишет, что один из способов использования осциллятора - открытие длинной позиции при снижении RSI в перепроданность (ниже 30) и открытие короткой позиции при повышении RSI до перекупленности (выше 70). Однако бэктест стратегии с такими вводными дает весьма посредственные результаты.
Исходя из формулы расчета, RSI рассчитывает скорость изменения цены за определенный период. Поэтому зоны перекупленности и перепроданности будут иметь относительное значение (относительно установленного периода расчета). Не зря ведь в названии осциллятора было добавлено слово "относительной". Стоит принять за аксиому утверждение, что цена актива справедлива в каждый момент времени.
По сути, RSI рассчитывает силу тренда. Если значение осциллятора выше 70, то на рынке с высокой долей вероятности происходит восходящее движение. Поэтому в текущей стратегии открытие лонга происходит именно в момент наибольшей силы покупателей (когда RSI > 80), то есть в сторону тренда, поскольку контртрендовая торговля по RSI показала свою несостоятельность. Закрытие позиции происходит после того, как покупатели теряют преимущество и RSI снижается до 40.
Стратегию рекомендуется использовать только с длинными позициями, поскольку короткие позиции показывают отрицательный результат. В стратегии используется скользящая средняя для RSI с периодом 14 для сглаживания данных осциллятора.

Median RSI**Description:**
The "Median RSI with Buy/Sell Signals and Bar Color" indicator on TradingView calculates the median Relative Strength Index (RSI) alongside buy and sell signals and customizable bar colors. RSI is a momentum oscillator that measures the speed and change of price movements. This indicator provides traders with insights into the relative strength of a security by comparing its recent gains to its recent losses.
**How it Works:**
1. **RSI Calculation:** The script computes the RSI using a specified length parameter. This RSI value indicates whether a security is overbought or oversold, helping traders identify potential reversal points.
2. **Median RSI Calculation:** It calculates the highest and lowest RSI values over a certain period and finds the median value. This median RSI acts as a benchmark, guiding traders in assessing the relative strength of a security compared to its recent performance.
3. **Bar Color Customization:** The script allows users to customize the bar color based on the relationship between the RSI and the median RSI. Bars are colored differently to visually represent whether the RSI is above, below, or equal to the median RSI. Additionally, the script highlights bars when they cross the median RSI, providing visual cues for potential shifts in market momentum.
**Benefits:**
- **RSI Insights:** Provides insights into the relative strength of a security by comparing its recent gains to its recent losses.
- **Buy/Sell Signals:** Generates buy and sell signals based on the RSI crossing above or below the median RSI, aiding traders in timing their trades.
- **Customizable Bar Colors:** Allows traders to customize bar colors based on the relationship between the RSI and the median RSI, facilitating quick visual analysis.
- **Visual Representation:** Visualizes the RSI median RSI, and bar color on the price chart for easy interpretation.
**Ideal Usage:**
- **Trend Confirmation:** Traders can use the indicator to confirm the direction of the trend before entering trades.
- **Reversal Signals:** Changes in RSI direction, indicated by crosses above or below the median RSI, can signal potential reversals in market momentum.
- **Combination with Other Indicators:** It can be used in conjunction with other technical indicators to enhance trading strategies, providing additional confirmation signals.
**Warnings:**
- **False Signals:** Like any technical indicator, false signals may occur, especially during periods of low volume or choppy market conditions. Additional analysis and risk management techniques should be used to avoid potential losses.
- **Parameter Sensitivity:** Traders should test different parameter settings and consider market conditions when using the indicator, as adjustments may affect its sensitivity to price movements.
By providing insights into RSI dynamics, and offering customizable bar colors, the "Median RSI with Buy/Sell Signals and Bar Color" indicator equips traders with valuable tools for technical analysis and decision-making in the financial markets.

MACD of Relative Strenght StrategyMACD Relative Strenght Strategy :
INTRODUCTION :
This strategy is based on two well-known indicators: MACD and Relative Strenght (RS). By coupling them, we obtain powerful buy signals. In fact, the special feature of this strategy is that it creates an indicator from an indicator. Thus, we construct a MACD whose source is the value of the RS. The strategy only takes buy signals, ignoring SHORT signals as they are mostly losers. There's also a money management method enabling us to reinvest part of the profits or reduce the size of orders in the event of substantial losses.
RELATIVE STRENGHT :
RS is an indicator that measures the anomaly between momentum and the assumption of market efficiency. It is used by professionals and is one of the most robust indicators. The idea is to own assets that do better than average, based on their past performance. We calculate RS using this formula :
RS = close/highest_high(RS_Length)
Where highest_high(RS_Length) = highest value of the high over a user-defined time period (which is the RS_Length).
We can thus situate the current price in relation to its highest price over this user-defined period.
MACD (Moving Average Convergence - Divergence) :
This is one of the best-known indicators, measuring the distance between two exponential moving averages : one fast and one slower. A wide distance indicates fast momentum and vice versa. We'll plot the value of this distance and call this line macdline. The MACD uses a third moving average with a lower period than the first two. This last moving average will give a signal when it crosses the macdline. It is therefore constructed using the values of the macdline as its source.
It's important to note that the first two MAs are constructed using RS values as their source. So we've just built an indicator of an indicator. This kind of method is very powerful because it is rarely used and brings value to the strategy.
PARAMETERS :
RS Length : Relative Strength length i.e. the number of candles back to find the highest high and compare the current price with this high. Default is 300.
MACD Fast Length : Relative Strength fast EMA length used to plot the MACD. Default is 14.
MACD Slow Length : Relative Strength slow EMA length used to plot the MACD. Default is 26.
MACD Signal Smoothing : Macdline SMA length used to plot the MACD. Default is 10.
Max risk per trade (in %) : The maximum loss a trade can incur (in percentage of the trade value). Default is 8%.
Fixed Ratio : This is the amount of gain or loss at which the order quantity is changed. Default is 400, meaning that for each $400 gain or loss, the order size is increased or decreased by a user-selected amount.
Increasing Order Amount : This is the amount to be added to or subtracted from orders when the fixed ratio is reached. The default is $200, which means that for every $400 gain, $200 is reinvested in the strategy. On the other hand, for every $400 loss, the order size is reduced by $200.
Initial capital : $1000
Fees : Interactive Broker fees apply to this strategy. They are set at 0.18% of the trade value.
Slippage : 3 ticks or $0.03 per trade. Corresponds to the latency time between the moment the signal is received and the moment the order is executed by the broker.
Important : A bot has been used to test the different parameters and determine which ones maximize return while limiting drawdown. This strategy is the most optimal on BITSTAMP:ETHUSD in 8h timeframe with the parameters set by default.
ENTER RULES :
The entry rules are very simple : we open a long position when the MACD value turns positive. You are therefore LONG when the MACD is green.
EXIT RULES :
We exit a position (whether losing or winning) when the MACD becomes negative, i.e. turns red.
RISK MANAGEMENT :
This strategy can incur losses, so it's important to manage our risks well. If the position is losing and has incurred a loss of -8%, our stop loss is activated to limit losses.
MONEY MANAGEMENT :
The fixed ratio method was used to manage our gains and losses. For each gain of an amount equal to the value of the fixed ratio, we increase the order size by a value defined by the user in the "Increasing order amount" parameter. Similarly, each time we lose an amount equal to the value of the fixed ratio, we decrease the order size by the same user-defined value. This strategy increases both performance and drawdown.
Enjoy the strategy and don't forget to take the trade :)

RMI Trend SniperThe "RMI Trend Sniper" is a powerful trend-following indicator designed to help traders identify potential buy and sell signals in the market.
It combines elements of the Relative Strength Index (RSI) and the Money Flow Index (MFI) to provide a comprehensive view of market momentum and strength.
🔷 Key Features:
🔹 Customizable Settings : Tailor the indicator to your trading preferences with customizable input parameters, including RSI and MFI lengths, threshold levels, and visual settings.
🔹 Momentum Signals : The indicator generates clear bullish and bearish momentum signals, allowing you to spot potential trend reversals or continuations.
🔹 The positive condition considers the previous RMI value, current RMI value, and positive change in the 5-period exponential moving average (EMA) of the closing price.
🔹 The negative condition looks at the current RMI value and negative change in the 5-period EMA.
🔹 Visual Bands : Visualize market volatility with dynamically plotted bands around the Range Weighted Moving Average (RWMA), providing insights into potential price fluctuations.
🔹 Candlestick Coloring : Easily identify bullish and bearish conditions with color-coded candlesticks, helping you make informed trading decisions.
The "RMI Trend Sniper" is a versatile tool suitable for traders of all experience levels. Whether you are a novice or an experienced trader, this indicator can help you enhance your technical analysis and improve your trading strategies.

Trend_Trader_WMA (Momentum)<---> Caution! This is first test version of indicator. I am ready to get more ideas+feedback to develop it more. <--->
The "Momentum_Trader_WMA" indicator is a versatile technical analysis tool designed to help traders identify potential trend changes and momentum shifts in the market. It combines multiple indicators and moving averages to provide a comprehensive view of price action and momentum.
Key Features:
Weighted Moving Averages (WMAs): The indicator calculates two different WMAs with user-defined lengths, providing a smoothed representation of price data.
Average True Range (ATR) Bands: ATR is used to calculate dynamic bands around the WMA Average. These bands can help traders gauge market volatility and potential breakout points. The color of the ATR bands can be seen as an early signal of trends or the continuation of current trends.
Commodity Channel Index (CCI): CCI is a momentum oscillator that measures the relative strength of price changes. The indicator calculates CCI values based on a user-defined period.
Exponential Moving Average (EMA) of CCI: An EMA of CCI is plotted to help identify trends and momentum shifts.
Color-Coded Bands: The ATR bands change colors based on CCI conditions, providing visual cues for potential trading opportunities. When ATR bands transition from narrow (indicating low volatility) to wide (indicating increased volatility), it can be seen as an early signal of a potential trend change or the continuation of the current trend.
Buy and Sell Signals: The indicator generates buy and sell signals based on crossovers of WMAs and CCI thresholds, making it easier for traders to identify entry and exit points.
Customizable Moving Averages: Traders can enable or disable different moving averages (e.g., SMA, EMA, WMA, RMA, VWMA, HMA) with various periods and colors to adapt the indicator to their trading preferences.
CCI Dot Alerts: Dots are displayed at the bottom of the chart based on CCI values, helping traders spot extreme CCI conditions.
How to Use:
Trend Identification: The WMAs and ATR bands can help identify the current trend direction and its strength. When the WMAs are in an uptrend (green) and the ATR bands widen, it may indicate a strong bullish trend. Conversely, when the WMAs are in a downtrend (red) and the ATR bands narrow, it may suggest a weakening bearish trend.
Momentum Confirmation: The CCI and its EMA provide insights into market momentum. Look for CCI crossovers above 100 for potential bullish momentum and below -100 for potential bearish momentum.
Buy and Sell Signals: Pay attention to the buy and sell signals generated by the indicator. Buy when the WMAs cross over and CCI crosses above 100. Sell when the WMAs cross under and CCI crosses below -100.
ATR Bands as Early Signals: The color changes in the ATR bands can be seen as early signals of trends or the continuation of current trends. Wide ATR bands may indicate increased volatility and potential trend changes, while narrow ATR bands suggest reduced volatility and potential trend continuation.
Moving Averages: Customize the indicator by enabling or disabling specific moving averages according to your preferred trading strategy.
CCI Dots: Use the CCI dots to identify extreme CCI conditions, which may indicate overbought or oversold market conditions.
PS:
Recommended to use Indicator with price action conecpts(eg. support and resistance) as they play important role in any market.
Buy and sell signals are not really accurate. I would personally look for trend shift in WMA middle line and confirmation from CCI dots at bottom. For example. If middle line turns green and within recent 3-4 candles (or next 3-4 candles) dots tunrns green also, that means momentum has been rised in the direction of bulls.
pls, take s/r concepts first when working. I am thinking to add more precise buy sell signal method to make it easier to trade.
Good luck with your trades :)

Zaree - FX Index RSI IndicatorDescription:
The "Zaree - FX Index RSI Indicator" (FIRI) is a technical analysis tool designed to provide insights into the relative strength of two selected currency indices using the Relative Strength Index (RSI). It allows traders to compare the RSI values of a primary currency index and a secondary currency index, helping them identify potential overbought and oversold conditions in the currency market.
Details of the Indicator:
The indicator calculates the RSI for both the primary and secondary currency indices based on the user's selections.
Traders can choose from a variety of currency indices to use as the primary and secondary indices for comparison.
The indicator offers settings for customizing the calculation of the RSI, including selecting the type of moving average (SMA, EMA, WMA, SMMA) and adjusting the length of the RSI and moving average.
Upper and lower RSI bands are displayed on the chart to highlight potential overbought and oversold conditions.
The RSI values and their corresponding moving average values are plotted on the chart, allowing traders to visually analyze the relative strength of the indices.
How to Use the Indicator:
Select the primary and secondary currency indices you want to compare from the provided dropdown menus. These indices will serve as the basis for RSI calculation.
Choose the type of moving average (SMA, EMA, WMA, SMMA) to use for RSI calculation and set the desired length for the moving average.
Decide whether you want to visualize the RSI and moving average values for the primary and secondary indices on the chart.
Observe the RSI values and moving averages plotted on the chart. The indicator's upper and lower bands can help you identify potential overbought (above the upper band) and oversold (below the lower band) conditions.
Pay attention to the intersections between the RSI values and the moving average lines. These intersections can provide insights into potential trend changes or reversals in the currency market.
Example of Usage:
Let's say you're a swing trader focusing on currency pairs involving the US Dollar (USD) and Euro (EUR). You want to compare the relative strength of the USD Index (USDINX) and the EUR Index (EURINX) to identify potential trading opportunities. Here's how you can use the FIRI indicator:
Select "USDINX" as the primary index and "EURINX" as the secondary index.
Choose "SMA" as the moving average type and set the RSI length to 14.
Enable the visualization of RSI values for both the primary and secondary indices.
Observe the chart to identify instances where the RSI values of the indices cross above the upper band (potential overbought) or below the lower band (potential oversold).
Look for intersections between the RSI values and the moving average lines. A bullish signal may occur when the RSI crosses above the moving average, indicating potential upward momentum, while a bearish signal may occur when the RSI crosses below the moving average, indicating potential downward momentum.
Remember that the FIRI indicator is a tool to assist you in your analysis. It's important to consider other technical and fundamental factors before making trading decisions.
Feel free to adjust the settings of the indicator based on your trading preferences and strategy. Keep in mind that no indicator is foolproof, and it's recommended to use the FIRI indicator in conjunction with other analysis techniques for a comprehensive trading approach.

Multi-Timeframe Trend Detector [Alifer]Here is an easy-to-use and customizable multi-timeframe visual trend indicator.
The indicator combines Exponential Moving Averages (EMA), Moving Average Convergence Divergence (MACD), and Relative Strength Index (RSI) to determine the trend direction on various timeframes: 15 minutes (15M), 30 minutes (30M), 1 hour (1H), 4 hours (4H), 1 day (1D), and 1 week (1W).
EMA Trend : The script calculates two EMAs for each timeframe: a fast EMA and a slow EMA. If the fast EMA is greater than the slow EMA, the trend is considered Bullish; if the fast EMA is less than the slow EMA, the trend is considered Bearish.
MACD Trend : The script calculates the MACD line and the signal line for each timeframe. If the MACD line is above the signal line, the trend is considered Bullish; if the MACD line is below the signal line, the trend is considered Bearish.
RSI Trend : The script calculates the RSI for each timeframe. If the RSI value is above a specified Bullish level, the trend is considered Bullish; if the RSI value is below a specified Bearish level, the trend is considered Bearish. If the RSI value is between the Bullish and Bearish levels, the trend is Neutral, and no arrow is displayed.
Dashboard Display :
The indicator prints arrows on the dashboard to represent Bullish (▲ Green) or Bearish (▼ Red) trends for each timeframe.
You can easily adapt the Dashboard colors (Inputs > Theme) for visibility depending on whether you're using a Light or Dark theme for TradingView.
Usage :
You can adjust the indicator's settings such as theme (Dark or Light), EMA periods, MACD parameters, RSI period, and Bullish/Bearish levels to adapt it to your specific trading strategies and preferences.
Disclaimer :
This indicator is designed to quickly help you identify the trend direction on multiple timeframes and potentially make more informed trading decisions.
You should consider it as an extra tool to complement your strategy, but you should not solely rely on it for making trading decisions.
Always perform your own analysis and risk management before executing trades.
The indicator will only show a Dashboard. The EMAs, RSI and MACD you see on the chart image have been added just to demonstrate how the script works.
DETAILED SCRIPT EXPLANATION
INPUTS:
theme : Allows selecting the color theme (options: "Dark" or "Light").
emaFastPeriod : The period for the fast EMA.
emaSlowPeriod : The period for the slow EMA.
macdFastLength : The fast length for MACD calculation.
macdSlowLength : The slow length for MACD calculation.
macdSignalLength : The signal length for MACD calculation.
rsiPeriod : The period for RSI calculation.
rsiBullishLevel : The level used to determine Bullish RSI condition, when RSI is above this value. It should always be higher than rsiBearishLevel.
rsiBearishLevel : The level used to determine Bearish RSI condition, when RSI is below this value. It should always be lower than rsiBullishLevel.
CALCULATIONS:
The script calculates EMAs on multiple timeframes (15-minute, 30-minute, 1-hour, 4-hour, daily, and weekly) using the request.security() function.
Similarly, the script calculates MACD values ( macdLine , signalLine ) on the same multiple timeframes using the request.security() function along with the ta.macd() function.
RSI values are also calculated for each timeframe using the request.security() function along with the ta.rsi() function.
The script then determines the EMA trends for each timeframe by comparing the fast and slow EMAs using simple boolean expressions.
Similarly, it determines the MACD trends for each timeframe by comparing the MACD line with the signal line.
Lastly, it determines the RSI trends for each timeframe by comparing the RSI values with the Bullish and Bearish RSI levels.
PLOTTING AND DASHBOARD:
Color codes are defined based on the EMA, MACD, and RSI trends for each timeframe. Green for Bullish, Red for Bearish.
A dashboard is created using the table.new() function, displaying the trend information for each timeframe with arrows representing Bullish or Bearish conditions.
The dashboard will appear in the top-right corner of the chart, showing the Bullish and Bearish trends for each timeframe (15M, 30M, 1H, 4H, 1D, and 1W) based on EMA, MACD, and RSI analysis. Green arrows represent Bullish trends, red arrows represent Bearish trends, and no arrows indicate Neutral conditions.
INFO ON USED INDICATORS:
1 — EXPONENTIAL MOVING AVERAGE (EMA)
The Exponential Moving Average (EMA) is a type of moving average (MA) that places a greater weight and significance on the most recent data points.
The EMA is calculated by taking the average of the true range over a specified period. The true range is the greatest of the following:
The difference between the current high and the current low.
The difference between the previous close and the current high.
The difference between the previous close and the current low.
The EMA can be used by traders to produce buy and sell signals based on crossovers and divergences from the historical average. Traders often use several different EMA lengths, such as 10-day, 50-day, and 200-day moving averages.
The formula for calculating EMA is as follows:
Compute the Simple Moving Average (SMA).
Calculate the multiplier for weighting the EMA.
Calculate the current EMA using the following formula:
EMA = Closing price x multiplier + EMA (previous day) x (1-multiplier)
2 — MOVING AVERAGE CONVERGENCE DIVERGENCE (MACD)
The Moving Average Convergence Divergence (MACD) is a popular trend-following momentum indicator used in technical analysis. It helps traders identify changes in the strength, direction, momentum, and duration of a trend in a financial instrument's price.
The MACD is calculated by subtracting a longer-term Exponential Moving Average (EMA) from a shorter-term EMA. The most commonly used time periods for the MACD are 26 periods for the longer EMA and 12 periods for the shorter EMA. The difference between the two EMAs creates the main MACD line.
Additionally, a Signal Line (usually a 9-period EMA) is computed, representing a smoothed version of the MACD line. Traders watch for crossovers between the MACD line and the Signal Line, which can generate buy and sell signals. When the MACD line crosses above the Signal Line, it generates a bullish signal, indicating a potential uptrend. Conversely, when the MACD line crosses below the Signal Line, it generates a bearish signal, indicating a potential downtrend.
In addition to the MACD line and Signal Line crossovers, traders often look for divergences between the MACD and the price chart. Divergence occurs when the MACD is moving in the opposite direction of the price, which can suggest a potential trend reversal.
3 — RELATIVE STRENGHT INDEX (RSI):
The Relative Strength Index (RSI) is another popular momentum oscillator used by traders to assess the overbought or oversold conditions of a financial instrument. The RSI ranges from 0 to 100 and measures the speed and change of price movements.
The RSI is calculated based on the average gain and average loss over a specified period, commonly 14 periods. The formula involves several steps:
Calculate the average gain over the specified period.
Calculate the average loss over the specified period.
Calculate the relative strength (RS) by dividing the average gain by the average loss.
Calculate the RSI using the following formula: RSI = 100 - (100 / (1 + RS))
The RSI oscillates between 0 and 100, where readings above 70 are considered overbought, suggesting that the price may have risen too far and could be due for a correction. Readings below 30 are considered oversold, suggesting that the price may have dropped too much and could be due for a rebound.
Traders often use the RSI to identify potential trend reversals. For example, when the RSI crosses above 30 from below, it may indicate the start of an uptrend, and when it crosses below 70 from above, it may indicate the start of a downtrend. Additionally, traders may look for bullish or bearish divergences between the RSI and the price chart, similar to the MACD analysis, to spot potential trend changes.

EMA Power BandsHello!
Today, I am delighted to introduce you to the "EMA Power Bands" indicator, designed to assist in identifying buying and selling points for assets moving in the markets.
Key Features of the Indicator:
EMA Bands: "EMA Power Bands" utilizes Exponential Moving Average (EMA) to create trend lines. These bands automatically expand or contract based on the price trend, adapting to market conditions.
ATR-Based Volatility: The indicator measures price volatility using the Average True Range (ATR) indicator, adjusting the width of the EMA bands accordingly. As a result, wider bands form during periods of increased volatility, while they narrow during lower volatility.
RSI-Based Buy-Sell Signals: "EMA Power Bands" uses the Relative Strength Index (RSI) to identify overbought and oversold zones. Entering the overbought zone generates a sell signal, while entering the oversold zone produces a buy signal.
Trend Direction Identification: The indicator assists in determining the price trend direction by analyzing the slope of the EMA bands. This allows you to identify periods of uptrends and downtrends.
Visualization of Buy-Sell Signals: "EMA Power Bands" visually marks the buy and sell signals:
- When RSI enters the overbought zone, it displays a sell signal (🪫).
- When RSI enters the oversold zone, it indicates a buy signal (🔋).
- When a candle closes above the emaup line, it displays a bearish signal (🔨).
- When a candle closes below the emadw line, it indicates a bullish signal (🚀).
By using the "EMA Power Bands" (EMA Güç Bantları) indicator, especially in trend-following strategies and periods of volatility, you can make more informed and disciplined trading decisions. However, I recommend using it in conjunction with other technical analysis tools and fundamental data.
*You can also use it with CCI as an example.
With this indicator, you can identify potential trend reversals in advance and strengthen your risk management strategies.
So, go ahead and try the "EMA Power Bands" (EMA Güç Bantları) indicator to enhance your technical analysis skills and make more informed trading decisions!

Variety Step RSI w/ Dynamic Zones [Loxx]Variety Step RSI w/ Dynamic Zones is a stepped RSI calculation with Discontinued Signal Lines. This indicator includes 7 types of RSI to choose from. The addition of the Discontinued Signal Lines allows this indicator to better identify momentum shifts in price so traders have better defined long/short signals.
Enhanced Moving Average Calculation with Stepped Moving Average and the Advantages over Regular RSI
Technical analysis plays a crucial role in understanding and predicting market trends. One popular indicator used by traders and analysts is the Relative Strength Index (RSI). However, an enhanced approach called Stepped Moving Average, in combination with the Slow RSI function, offers several advantages over regular RSI calculations.
█ Stepped Moving Average and Moving Averages:
The Stepped Moving Average function serves as a crucial component in the calculation of moving averages. Moving averages smooth out price data over a specific period to identify trends and potential trading signals. By employing the Stepped Moving Average function, traders can enhance the accuracy of moving averages and make more informed decisions.
Stepped Moving Average takes two parameters:
The current RSI value and a size parameter. It computes the next step in the moving average calculation by determining the upper and lower bounds of the moving average range. It accomplishes this by adjusting the values of smax and smin based on the given RSI and size.
Furthermore, Stepped Moving Average introduces the concept of a trend variable. By comparing the previous trend value with the current RSI and the previous upper and lower bounds, it updates the trend accordingly. This feature enables traders to identify potential shifts in market sentiment and make timely adjustments to their trading strategies.
█ Advantages over Regular RSI:
Enhanced Range Boundaries:
The inclusion of size parameters in Stepped Moving Average allows for more precise determination of the upper and lower bounds of the moving average range. This feature provides traders with a clearer understanding of the potential price levels that can influence market behavior. Consequently, it aids in setting more effective entry and exit points for trades.
Improved Trend Identification:
The trend variable in Stepped Moving Average helps traders identify changes in market trends more accurately. By considering the previous trend value and comparing it to the current RSI and previous bounds, Stepped Moving Average captures trend reversals with greater precision. This capability empowers traders to respond swiftly to market shifts and potentially capture more profitable trading opportunities.
Smoother Moving Averages:
Stepped Moving Average's ability to adjust the moving average range bounds based on trend changes and size parameters results in smoother moving averages. Regular RSI calculations may produce jagged or erratic results due to abrupt market movements. Stepped Moving Average mitigates this issue by dynamically adapting the range boundaries, thereby providing traders with more reliable and consistent moving average signals.
Complementary Functionality with Slow RSI:
Stepped Moving Average and Slow RSI function in harmony to provide a comprehensive trading analysis toolkit. While Stepped Moving Average refines the moving average calculation process, Slow RSI offers a more accurate representation of market strength. The combination of these two functions facilitates a deeper understanding of market dynamics and assists traders in making better-informed decisions.
What is a Discontinued Signal Line (DSL)?
Many indicators employ signal lines to more easily identify trends or desired states of the indicator. The concept of a signal line is straightforward: by comparing a value to its smoothed, slightly lagging state, one can determine the current momentum or state.
The Discontinued Signal Line builds on this fundamental idea by extending it: rather than having a single signal line, multiple lines are used based on the indicator's current value.
The "signal" line is calculated as follows:
When a specific level is crossed in the desired direction, the EMA of that value is calculated for the intended signal line.
When that level is crossed in the opposite direction, the previous "signal" line value is "inherited," becoming a sort of level.
This approach combines signal lines and levels, aiming to integrate the advantages of both methods.
In essence, DSL enhances the signal line concept by inheriting the previous signal line's value and converting it into a level.
Extras
-Alerts
-Signals
Related indicators:
Step RSI

Volume-Weighted RSI with Adaptive SmoothingThis indicator is designed to provide traders with insights into the relative strength of a security by incorporating volume-weighted elements, effectively combining the concepts of Relative Strength Index (RSI) and volume-weighted averages to generate meaningful trading signals.
The indicator calculates the traditional RSI, which measures the speed and change of price movements, as well as the volume-weighted RSI, which considers the influence of trading volume on price action. It then applies adaptive smoothing to the volume-weighted RSI, allowing for customization of the smoothing process. The resulting smoothed volume-weighted RSI is plotted alongside the original RSI, providing traders with a comprehensive view of the price strength dynamics.
The line coloration in this indicator is designed to provide visual cues about the relationship between the RSI and the volume-weighted RSI. When the RSI line is above or equal to the volume-weighted RSI line, it suggests a potentially bullish condition with positive market momentum. In such cases, the line is colored lime. Conversely, when the RSI line (fuchsia) is below the volume-weighted RSI line, it indicates a potentially bearish condition with negative market momentum. The line color is set to fuchsia. By observing the line color, traders can quickly assess the relative strength between the RSI and the volume-weighted RSI, aiding their decision-making process.
The bar color and background color further enhance the visual interpretation of the indicator. The bar color reflects the RSI's relationship with the volume-weighted RSI and the predefined thresholds. If the RSI line is above both the volume-weighted RSI line and the overbought threshold (70), the bar color is set to lime, indicating a potentially overbought condition. Conversely, if the RSI line is below both the volume-weighted RSI line and the oversold threshold (30), the bar color is set to fuchsia, suggesting a potentially oversold condition. When the RSI line is between these two thresholds, the bar color is set to yellow, indicating a neutral or intermediate state. The background color, displayed with a semi-transparent shade, provides additional context by reflecting the prevailing market conditions. It turns lime if the volume-weighted RSI is above the overbought threshold, fuchsia if below the oversold threshold, and yellow if it falls between these two thresholds. This coloration scheme aids traders in quickly assessing market conditions and potential trading opportunities.
Calculations:
-- RSI Calculation : The traditional RSI is calculated based on the price movements of the asset. The up and down movements are determined, and exponential moving averages are used to smooth the values. The RSI value ranges from 0 to 100, with levels above 70 indicating overbought conditions and levels below 30 indicating oversold conditions.
-- Volume-Weighted RSI Calculation : The volume-weighted RSI incorporates the trading volume of the asset into the calculations. The closing price is multiplied by the corresponding volume, and the average is taken over a specific length. The up and down movements are smoothed using exponential moving averages to generate the volume-weighted RSI value.
-- Adaptive Smoothing : The indicator offers an adaptive smoothing option, allowing traders to customize the smoothing process of the volume-weighted RSI. By adjusting the smoothing length, traders can fine-tune the responsiveness of the indicator to changes in market conditions. Smoothing helps reduce noise and enhances the clarity of the signals.
Interpretation:
The indicator provides two main components for interpretation:
-- RSI : The traditional RSI reflects the price momentum and potential overbought or oversold conditions. Traders can look for RSI values above 70 as potential overbought signals, suggesting a possible price reversal or correction. Conversely, RSI values below 30 indicate potential oversold signals, indicating a potential price rebound or rally.
-- Volume-Weighted RSI : The volume-weighted RSI incorporates trading volume, which provides insights into the strength of price movements. When the volume-weighted RSI is above the traditional RSI, it suggests that the buying pressure supported by higher volume is stronger, potentially indicating a more reliable trend. Conversely, when the volume-weighted RSI is below the traditional RSI, it suggests that the selling pressure supported by higher volume is stronger, potentially indicating a more significant price reversal.
Potential Strategies:
-- Overbought and Oversold Signals : Traders can utilize the RSI component of the indicator to identify overbought and oversold conditions. A potential strategy is to consider taking short positions when the RSI is above 70 and long positions when the RSI is below 30. These levels can act as dynamic support and resistance areas, indicating possible price reversals.
-- Confirmation with Volume : Traders can use the volume-weighted RSI as a confirmation tool to validate price movements. When the volume-weighted RSI is above the traditional RSI, it may provide additional confirmation for long positions, suggesting stronger buying pressure. Conversely, when the volume-weighted RSI is below the traditional RSI, it may provide confirmation for short positions, indicating stronger selling pressure.
-- Trend Reversal Strategy : Watch for the volume-weighted RSI to reach extreme levels above 70 (overbought) or below 30 (oversold). Look for a reversal signal where the RSI line (green or fuchsia) crosses below or above the volume-weighted RSI line. Enter a trade when the reversal signal occurs, and the RSI line changes color. Exit the trade when the RSI line crosses back in the opposite direction or reaches the opposite extreme level.
-- Divergence Strategy : Compare the direction of the RSI line (green or fuchsia) with the volume-weighted RSI line. A bullish divergence occurs when the RSI line makes higher lows while the volume-weighted RSI line makes lower lows. A bearish divergence occurs when the RSI line makes lower highs while the volume-weighted RSI line makes higher highs. Once a divergence is identified, wait for the RSI line to cross above or below the volume-weighted RSI line as confirmation of a potential trend reversal. Consider using additional indicators or price action analysis to time the entry more accurately. Use stop-loss orders and profit targets to manage risk and secure profits.
-- Trend Continuation Strategy : Assess the overall trend direction by observing the RSI line's position relative to the volume-weighted RSI line. When the RSI line consistently stays above the volume-weighted RSI line, it indicates a bullish trend, while the opposite suggests a bearish trend. Look for temporary pullbacks within the ongoing trend where the RSI line (green or fuchsia) touches or crosses the volume-weighted RSI line. Enter trades in the direction of the dominant trend when the RSI line crosses back in the trend direction. Exit the trade when the RSI line starts to deviate significantly from the volume-weighted RSI line or when the trend shows signs of weakening through other technical or fundamental factors.
Limitations:
-- False Signals : Like any indicator, the "Volume-Weighted RSI with Adaptive Smoothing" may produce false signals, especially during periods of low liquidity or choppy market conditions. Traders should exercise caution and consider using additional confirmation indicators or tools to validate the signals generated by this indicator.
-- Lagging Nature : The indicator relies on historical price data and volume to calculate the RSI and volume-weighted RSI. As a result, the signals provided may have a certain degree of lag compared to real-time price action. Traders should be aware of this inherent lag and consider combining the indicator with other timely indicators to enhance the accuracy of their trading decisions.
-- Parameter Sensitivity : The indicator's effectiveness can be influenced by the choice of parameters, such as the length of the RSI, smoothing length, and adaptive smoothing option. Different market conditions may require adjustments to these parameters to optimize performance. Traders are encouraged to conduct thorough testing and analysis to determine the most suitable parameter values for their specific trading strategies and preferences.
-- Market Conditions : The indicator's performance may vary depending on the prevailing market conditions. It is essential to understand that no indicator can guarantee accurate predictions or consistently profitable trades. Traders should consider the broader market context, fundamental factors, and other technical indicators to complement the insights provided by the "Volume-Weighted RSI with Adaptive Smoothing" indicator.
-- Subjectivity : Interpretation of the indicator's signals involves subjective judgment. Traders may have varying interpretations of overbought and oversold levels, as well as the significance of the volume-weighted RSI in relation to the traditional RSI. It is crucial to combine the indicator with personal analysis and trading experience to make informed trading decisions.
Remember, no single indicator can provide foolproof trading signals. The "Volume-Weighted RSI with Adaptive Smoothing" indicator serves as a valuable tool for analyzing price strength and volume dynamics. It can assist traders in identifying potential entry and exit points, validating trends, and managing risk. However, it should be used as part of a comprehensive trading strategy that considers multiple factors and indicators to increase the likelihood of successful trades.

Step RSI [Loxx]Enhanced Moving Average Calculation with Stepped Moving Average and the Advantages over Regular RSI
Technical analysis plays a crucial role in understanding and predicting market trends. One popular indicator used by traders and analysts is the Relative Strength Index (RSI). However, an enhanced approach called Stepped Moving Average, in combination with the Slow RSI function, offers several advantages over regular RSI calculations.
Stepped Moving Average and Moving Averages:
The Stepped Moving Average function serves as a crucial component in the calculation of moving averages. Moving averages smooth out price data over a specific period to identify trends and potential trading signals. By employing the Stepped Moving Average function, traders can enhance the accuracy of moving averages and make more informed decisions.
Stepped Moving Average takes two parameters: the current RSI value and a size parameter. It computes the next step in the moving average calculation by determining the upper and lower bounds of the moving average range. It accomplishes this by adjusting the values of smax and smin based on the given RSI and size.
Furthermore, Stepped Moving Average introduces the concept of a trend variable. By comparing the previous trend value with the current RSI and the previous upper and lower bounds, it updates the trend accordingly. This feature enables traders to identify potential shifts in market sentiment and make timely adjustments to their trading strategies.
Advantages over Regular RSI:
Enhanced Range Boundaries:
The inclusion of size parameters in Stepped Moving Average allows for more precise determination of the upper and lower bounds of the moving average range. This feature provides traders with a clearer understanding of the potential price levels that can influence market behavior. Consequently, it aids in setting more effective entry and exit points for trades.
Improved Trend Identification:
The trend variable in Stepped Moving Average helps traders identify changes in market trends more accurately. By considering the previous trend value and comparing it to the current RSI and previous bounds, Stepped Moving Average captures trend reversals with greater precision. This capability empowers traders to respond swiftly to market shifts and potentially capture more profitable trading opportunities.
Smoother Moving Averages:
Stepped Moving Average's ability to adjust the moving average range bounds based on trend changes and size parameters results in smoother moving averages. Regular RSI calculations may produce jagged or erratic results due to abrupt market movements. Stepped Moving Average mitigates this issue by dynamically adapting the range boundaries, thereby providing traders with more reliable and consistent moving average signals.
Complementary Functionality with Slow RSI:
Stepped Moving Average and Slow RSI function in harmony to provide a comprehensive trading analysis toolkit. While Stepped Moving Average refines the moving average calculation process, Slow RSI offers a more accurate representation of market strength. The combination of these two functions facilitates a deeper understanding of market dynamics and assists traders in making better-informed decisions.
Extras
-Alerts
-Signals

Cobra's CryptoMarket VisualizerCobra's Crypto Market Screener is designed to provide a comprehensive overview of the top 40 marketcap cryptocurrencies in a table\heatmap format. This indicator incorporates essential metrics such as Beta, Alpha, Sharpe Ratio, Sortino Ratio, Omega Ratio, Z-Score, and Average Daily Range (ADR). The table utilizes cell coloring resembling a heatmap, allowing for quick visual analysis and comparison of multiple cryptocurrencies.
The indicator also includes a shortened explanation tooltip of each metric when hovering over it's respected cell. I shall elaborate on each here for anyone interested.
Metric Descriptions:
1. Beta: measures the sensitivity of an asset's returns to the overall market returns. It indicates how much the asset's price is likely to move in relation to a benchmark index. A beta of 1 suggests the asset moves in line with the market, while a beta greater than 1 implies the asset is more volatile, and a beta less than 1 suggests lower volatility.
2. Alpha: is a measure of the excess return generated by an investment compared to its expected return, given its risk (as indicated by its beta). It assesses the performance of an investment after adjusting for market risk. Positive alpha indicates outperformance, while negative alpha suggests underperformance.
3. Sharpe Ratio: measures the risk-adjusted return of an investment or portfolio. It evaluates the excess return earned per unit of risk taken. A higher Sharpe ratio indicates better risk-adjusted performance, as it reflects a higher return for each unit of volatility or risk.
4. Sortino Ratio: is a risk-adjusted measure similar to the Sharpe ratio but focuses only on downside risk. It considers the excess return per unit of downside volatility. The Sortino ratio emphasizes the risk associated with below-target returns and is particularly useful for assessing investments with asymmetric risk profiles.
5. Omega Ratio: measures the ratio of the cumulative average positive returns to the cumulative average negative returns. It assesses the reward-to-risk ratio by considering both upside and downside performance. A higher Omega ratio indicates a higher reward relative to the risk taken.
6. Z-Score: is a statistical measure that represents the number of standard deviations a data point is from the mean of a dataset. In finance, the Z-score is commonly used to assess the financial health or risk of a company. It quantifies the distance of a company's financial ratios from the average and provides insight into its relative position.
7. Average Daily Range: ADR represents the average range of price movement of an asset during a trading day. It measures the average difference between the high and low prices over a specific period. Traders use ADR to gauge the potential price range within which an asset might fluctuate during a typical trading session.
Utility:
Comprehensive Overview: The indicator allows for monitoring up to 40 cryptocurrencies simultaneously, providing a consolidated view of essential metrics in a single table.
Efficient Comparison: The heatmap-like coloring of the cells enables easy visual comparison of different cryptocurrencies, helping identify relative strengths and weaknesses.
Risk Assessment: Metrics such as Beta, Alpha, Sharpe Ratio, Sortino Ratio, and Omega Ratio offer insights into the risk associated with each cryptocurrency, aiding risk assessment and portfolio management decisions.
Performance Evaluation: The Alpha, Sharpe Ratio, and Sortino Ratio provide measures of a cryptocurrency's performance adjusted for risk. This helps assess investment performance over time and across different assets.
Market Analysis: By considering the Z-Score and Average Daily Range (ADR), traders can evaluate the financial health and potential price volatility of cryptocurrencies, aiding in trade selection and risk management.
Features:
Reference period optimization, alpha and ADR in particular
Source calculation
Table sizing and positioning options to fit the user's screen size.
Tooltips
Important Notes -
1. The Sharpe, Sortino and Omega ratios cell coloring threshold might be subjective, I did the best I can to gauge the median value of each to provide more accurate coloring sentiment, it may change in the future.
The median values are : Sharpe -1, Sortino - 1.5, Omega - 20.
2. Limitations - Some cryptos have a Z-Score value of NaN due to their short lifetime, I tried to overcome this issue as with the rest of the metrics as best I can. Moreover, it limits the time horizon for replay mode to somewhere around Q3 of 2021 and that's with using the split option of the top half, to remain with the older cryptos.
3. For the beginner Pine enthusiasts, I recommend scimming through the script as it serves as a prime example of using key features, to name a few : Arrays, User Defined Functions, User Defined Types, For loops, Switches and Tables.
4. Beta and Alpha's benchmark instrument is BTC, due to cryptos volatility I saw no reason to use SPY or any other asset for that matter.

Exhaustion Improved Scalping Consolidation and Squeeze IndicatorThis custom indicator, called " Exhaustion & Improved Scalping Consolidation and Squeeze Indicator," is designed to help traders identify potential trading opportunities in the context of price consolidations, squeezes, and momentum exhaustion. It is an overlay indicator that combines several popular technical analysis tools, including the Relative Strength Index (RSI), Moving Average Convergence Divergence (MACD), Bollinger Bands, Keltner Channels, and Rate of Change (ROC). By analyzing these metrics, the indicator aims to provide visual cues on price charts to support better decision-making in the markets.
Use Case for Trading:
Consolidation Detection: The indicator identifies periods of price consolidation, which typically occur when a market is experiencing low volatility and trading in a narrow range. During these periods, the RSI value is between 45 and 55, the MACD histogram is close to zero, and the ROC value is low. The indicator highlights these consolidation periods by coloring the price bars yellow. Traders can use this information to anticipate potential breakouts and prepare for a possible trend initiation.
Squeeze Detection: The indicator detects squeezes by comparing the Bollinger Bands and Keltner Channels. A squeeze occurs when the Bollinger Bands are within the Keltner Channels, indicating that price volatility is decreasing. The indicator colors the price bars orange during a squeeze, which can be a signal for traders to watch for an upcoming increase in volatility and potential trend expansion.
Momentum Exhaustion Detection: The indicator identifies exhaustion in momentum by analyzing the RSI and MACD histogram. When the RSI is above 70, indicating overbought conditions, and the MACD histogram is decreasing, it may signal that the current upward momentum is losing strength. The indicator colors the price bars white in these situations. Traders can use this information to potentially exit long positions or prepare for a trend reversal.

Advanced VWAP_Pullback Strategy_Trend-Template QualifierGeneral Description and Unique Features of this Script
Introducing the Advanced VWAP Momentum-Pullback Strategy (long-only) that offers several unique features:
1. Our script/strategy utilizes Mark Minervini's Trend-Template as a qualifier for identifying stocks and other financial securities in confirmed uptrends. Mark Minervini, a 2x US Investment Champion, developed the Trend-Template, which covers eight different and independent characteristics that can be adjusted and optimized in this trend-following strategy to ensure the best results. The strategy will only trigger buy-signals in case the optimized qualifiers are being met.
2. Our strategy is based on the supply/demand balance in the market, making it timeless and effective across all timeframes. Whether you are day trading using 1- or 5-min charts or swing-trading using daily charts, this strategy can be applied and works very well.
3. We have also integrated technical indicators such as the RSI and the MA / VWAP crossover into this strategy to identify low-risk pullback entries in the context of confirmed uptrends. By doing so, the risk profile of this strategy and drawdowns are being reduced to an absolute minimum.
Minervini’s Trend-Template and the ‘Stage-Analysis’ of the Markets
This strategy is a so-called 'long-only' strategy. This means that we only take long positions, short positions are not considered.
The best market environment for such strategies are periods of stable upward trends in the so-called stage 2 - uptrend.
In stable upward trends, we increase our market exposure and risk.
In sideways markets and downward trends or bear markets, we reduce our exposure very quickly or go 100% to cash and wait for the markets to recover and improve. This allows us to avoid major losses and drawdowns.
This simple rule gives us a significant advantage over most undisciplined traders and amateurs!
'The Trend is your Friend'. This is a very old but true quote.
What's behind it???
• 98% of stocks made their biggest gains in a Phase 2 upward trend.
• If a stock is in a stable uptrend, this is evidence that larger institutions are buying the stock sustainably.
• By focusing on stocks that are in a stable uptrend, the chances of profit are significantly increased.
• In a stable uptrend, investors know exactly what to expect from further price developments. This makes it possible to locate low-risk entry points.
The goal is not to buy at the lowest price – the goal is to buy at the right price!
Each stock goes through the same maturity cycle – it starts at stage 1 and ends at stage 4
Stage 1 – Neglect Phase – Consolidation
Stage 2 – Progressive Phase – Accumulation
Stage 3 – Topping Phase – Distribution
Stage 4 – Downtrend – Capitulation
This strategy focuses on identifying stocks in confirmed stage 2 uptrends. This in itself gives us an advantage over long-term investors and less professional traders.
By focusing on stocks in a stage 2 uptrend, we avoid losses in downtrends (stage 4) or less profitable consolidation phases (stages 1 and 3). We are fully invested and put our money to work for us, and we are fully invested when stocks are in their stage 2 uptrends.
But how can we use technical chart analysis to find stocks that are in a stable stage 2 uptrend?
Mark Minervini has developed the so-called 'trend template' for this purpose. This is an essential part of our JS-TechTrading pullback strategy. For our watchlists, only those individual values that meet the tough requirements of Minervini's trend template are eligible.
The Trend Template
• 200d MA increasing over a period of at least 1 month, better 4-5 months or longer
• 150d MA above 200d MA
• 50d MA above 150d MA and 200d MA
• Course above 50d MA, 150d MA and 200d MA
• Ideally, the 50d MA is increasing over at least 1 month
• Price at least 25% above the 52w low
• Price within 25% of 52w high
• High relative strength according to IBD.
NOTE: In this basic version of the script, the Trend-Template has to be used as a separate indicator on TradingView (Public Trend-Template indicators are available in TradingView – community scripts). It is recommended to only execute buy signals in case the stock or financial security is in a stage 2 uptrend, which means that the criteria of the trend-template are fulfilled.
This strategy can be applied to all timeframes from 5 min to daily.
The VWAP Momentum-Pullback Strategy
For the JS-TechTrading VWAP Momentum-Pullback Strategy, only stocks and other financial instruments that meet the selected criteria of Mark Minervini's trend template are recommended for algorithmic trading with this startegy.
A further prerequisite for generating a buy signals is that the individual value is in a short-term oversold state (RSI).
When the selling pressure is over and the continuation of the uptrend can be confirmed by the MA / VWAP crossover after reaching a price low, a buy signal is issued by this strategy.
Stop-loss limits and profit targets can be set variably. You also have the option to make use of the trailing stop exit strategy.
Relative Strength Index (RSI)
The Relative Strength Index (RSI) is a technical indicator developed by Welles Wilder in 1978. The RSI is used to perform a market value analysis and identify the strength of a trend as well as overbought and oversold conditions. The indicator is calculated on a scale from 0 to 100 and shows how much an asset has risen or fallen relative to its own price in recent periods.
The RSI is calculated as the ratio of average profits to average losses over a certain period of time. A high value of the RSI indicates an overbought situation, while a low value indicates an oversold situation. Typically, a value > 70 is considered an overbought threshold and a value < 30 is considered an oversold threshold. A value above 70 signals that a single value may be overvalued and a decrease in price is likely , while a value below 30 signals that a single value may be undervalued and an increase in price is likely.
For example, let's say you're watching a stock XYZ. After a prolonged falling movement, the RSI value of this stock has fallen to 26. This means that the stock is oversold and that it is time for a potential recovery. Therefore, a trader might decide to buy this stock in the hope that it will rise again soon.
The MA / VWAP Crossover Trading Strategy
This strategy combines two popular technical indicators: the Moving Average (MA) and the Volume Weighted Average Price (VWAP). The MA VWAP crossover strategy is used to identify potential trend reversals and entry/exit points in the market.
The VWAP is calculated by taking the average price of an asset for a given period, weighted by the volume traded at each price level. The MA, on the other hand, is calculated by taking the average price of an asset over a specified number of periods. When the MA crosses above the VWAP, it suggests that buying pressure is increasing, and it may be a good time to enter a long position. When the MA crosses below the VWAP, it suggests that selling pressure is increasing, and it may be a good time to exit a long position or enter a short position.
Traders typically use the MA VWAP crossover strategy in conjunction with other technical indicators and fundamental analysis to make more informed trading decisions. As with any trading strategy, it is important to carefully consider the risks and potential rewards before making any trades.
This strategy is applicable to all timeframes and the relevant parameters for the underlying indicators (RSI and MA/VWAP) can be adjusted and optimized as needed.
Backtesting
Backtesting gives outstanding results on all timeframes and drawdowns can be reduced to a minimum level. In this example, the hourly chart for MCFT has been used.
Settings for backtesting are:
- Period from Jan 2020 until March 2023
- Starting capital 100k USD
- Position size = 25% of equity
- 0.01% commission = USD 2.50.- per Trade
- Slippage = 2 ticks
Other comments
- This strategy has been designed to identify the most promising, highest probability entries and trades for each stock or other financial security.
- The combination of the Trend-Template and the RSI qualifiers results in a highly selective strategy which only considers the most promising swing-trading entries. As a result, you will normally only find a low number of trades for each stock or other financial security per year in case you apply this strategy for the daily charts. Shorter timeframes will result in a higher number of trades / year.
- Consequently, traders need to apply this strategy for a full watchlist rather than just one financial security.

JS-TechTrading: VWAP Momentum_Pullback StrategyGeneral Description and Unique Features of this Script
Introducing the VWAP Momentum-Pullback Strategy (long-only) that offers several unique features:
1. Our script/strategy utilizes Mark Minervini's Trend-Template as a qualifier for identifying stocks and other financial securities in confirmed uptrends.
NOTE: In this basic version of the script, the Trend-Template has to be used as a separate indicator on TradingView (Public Trend-Template indicators are available on TradingView – community scripts). It is recommended to only execute buy signals in case the stock or financial security is in a stage 2 uptrend, which means that the criteria of the trend-template are fulfilled.
2. Our strategy is based on the supply/demand balance in the market, making it timeless and effective across all timeframes. Whether you are day trading using 1- or 5-min charts or swing-trading using daily charts, this strategy can be applied and works very well.
3. We have also integrated technical indicators such as the RSI and the MA / VWAP crossover into this strategy to identify low-risk pullback entries in the context of confirmed uptrends. By doing so, the risk profile of this strategy and drawdowns are being reduced to an absolute minimum.
Minervini’s Trend-Template and the ‘Stage-Analysis’ of the Markets
This strategy is a so-called 'long-only' strategy. This means that we only take long positions, short positions are not considered.
The best market environment for such strategies are periods of stable upward trends in the so-called stage 2 - uptrend.
In stable upward trends, we increase our market exposure and risk.
In sideways markets and downward trends or bear markets, we reduce our exposure very quickly or go 100% to cash and wait for the markets to recover and improve. This allows us to avoid major losses and drawdowns.
This simple rule gives us a significant advantage over most undisciplined traders and amateurs!
'The Trend is your Friend'. This is a very old but true quote.
What's behind it???
• 98% of stocks made their biggest gains in a Phase 2 upward trend.
• If a stock is in a stable uptrend, this is evidence that larger institutions are buying the stock sustainably.
• By focusing on stocks that are in a stable uptrend, the chances of profit are significantly increased.
• In a stable uptrend, investors know exactly what to expect from further price developments. This makes it possible to locate low-risk entry points.
The goal is not to buy at the lowest price – the goal is to buy at the right price!
Each stock goes through the same maturity cycle – it starts at stage 1 and ends at stage 4
Stage 1 – Neglect Phase – Consolidation
Stage 2 – Progressive Phase – Accumulation
Stage 3 – Topping Phase – Distribution
Stage 4 – Downtrend – Capitulation
This strategy focuses on identifying stocks in confirmed stage 2 uptrends. This in itself gives us an advantage over long-term investors and less professional traders.
By focusing on stocks in a stage 2 uptrend, we avoid losses in downtrends (stage 4) or less profitable consolidation phases (stages 1 and 3). We are fully invested and put our money to work for us, and we are fully invested when stocks are in their stage 2 uptrends.
But how can we use technical chart analysis to find stocks that are in a stable stage 2 uptrend?
Mark Minervini has developed the so-called 'trend template' for this purpose. This is an essential part of our JS-TechTrading pullback strategy. For our watchlists, only those individual values that meet the tough requirements of Minervini's trend template are eligible.
The Trend Template
• 200d MA increasing over a period of at least 1 month, better 4-5 months or longer
• 150d MA above 200d MA
• 50d MA above 150d MA and 200d MA
• Course above 50d MA, 150d MA and 200d MA
• Ideally, the 50d MA is increasing over at least 1 month
• Price at least 25% above the 52w low
• Price within 25% of 52w high
• High relative strength according to IBD.
NOTE: In this basic version of the script, the Trend-Template has to be used as a separate indicator on TradingView (Public Trend-Template indicators are available in TradingView – community scripts). It is recommended to only execute buy signals in case the stock or financial security is in a stage 2 uptrend, which means that the criteria of the trend-template are fulfilled.
This strategy can be applied to all timeframes from 5 min to daily.
The VWAP Momentum-Pullback Strateg y
For the JS-TechTrading VWAP Momentum-Pullback Strategy, only stocks and other financial instruments that meet the selected criteria of Mark Minervini's trend template are recommended for algorithmic trading with this startegy.
A further prerequisite for generating a buy signals is that the individual value is in a short-term oversold state (RSI).
When the selling pressure is over and the continuation of the uptrend can be confirmed by the MA / VWAP crossover after reaching a price low, a buy signal is issued by this strategy.
Stop-loss limits and profit targets can be set variably.
Relative Strength Index (RSI)
The Relative Strength Index (RSI) is a technical indicator developed by Welles Wilder in 1978. The RSI is used to perform a market value analysis and identify the strength of a trend as well as overbought and oversold conditions. The indicator is calculated on a scale from 0 to 100 and shows how much an asset has risen or fallen relative to its own price in recent periods.
The RSI is calculated as the ratio of average profits to average losses over a certain period of time. A high value of the RSI indicates an overbought situation, while a low value indicates an oversold situation. Typically, a value > 70 is considered an overbought threshold and a value < 30 is considered an oversold threshold. A value above 70 signals that a single value may be overvalued and a decrease in price is likely , while a value below 30 signals that a single value may be undervalued and an increase in price is likely.
For example, let's say you're watching a stock XYZ. After a prolonged falling movement, the RSI value of this stock has fallen to 26. This means that the stock is oversold and that it is time for a potential recovery. Therefore, a trader might decide to buy this stock in the hope that it will rise again soon.
The MA / VWAP Crossover Trading Strategy
This strategy combines two popular technical indicators: the Moving Average (MA) and the Volume Weighted Average Price (VWAP). The MA VWAP crossover strategy is used to identify potential trend reversals and entry/exit points in the market.
The VWAP is calculated by taking the average price of an asset for a given period, weighted by the volume traded at each price level. The MA, on the other hand, is calculated by taking the average price of an asset over a specified number of periods. When the MA crosses above the VWAP, it suggests that buying pressure is increasing, and it may be a good time to enter a long position. When the MA crosses below the VWAP, it suggests that selling pressure is increasing, and it may be a good time to exit a long position or enter a short position.
Traders typically use the MA VWAP crossover strategy in conjunction with other technical indicators and fundamental analysis to make more informed trading decisions. As with any trading strategy, it is important to carefully consider the risks and potential rewards before making any trades.
This strategy is applicable to all timeframes and the relevant parameters for the underlying indicators (RSI and MA/VWAP) can be adjusted and optimized as needed.
Backtesting
Backtesting gives outstanding results on all timeframes and drawdowns can be reduced to a minimum level. In this example, the hourly chart for MCFT has been used.
Settings for backtesting are:
- Period from April 2020 until April 2021 (1 yr)
- Starting capital 100k USD
- Position size = 25% of equity
- 0.01% commission = USD 2.50.- per Trade
- Slippage = 2 ticks
Other comments
• This strategy has been designed to identify the most promising, highest probability entries and trades for each stock or other financial security.
• The RSI qualifier is highly selective and filters out the most promising swing-trading entries. As a result, you will normally only find a low number of trades for each stock or other financial security per year in case you apply this strategy for the daily charts. Shorter timeframes will result in a higher number of trades / year.
• As a result, traders need to apply this strategy for a full watchlist rather than just one financial security.

Super 6x: RSI, MACD, Stoch, Loxxer, CCI, & Velocity [Loxx]Super 6x: RSI , MACD , Stoch , Loxxer, CCI , & Velocity is a combination of 6 indicators into one histogram. This includes the option to allow repainting.
What is MACD?
Moving average convergence divergence ( MACD ) is a trend-following momentum indicator that shows the relationship between two moving averages of a security’s price. The MACD is calculated by subtracting the 26-period exponential moving average ( EMA ) from the 12-period EMA .
What is CCI?
The Commodity Channel Index ( CCI ) measures the current price level relative to an average price level over a given period of time. CCI is relatively high when prices are far above their average. CCI is relatively low when prices are far below their average. Using this method, CCI can be used to identify overbought and oversold levels.
What is RSI?
The relative strength index is a technical indicator used in the analysis of financial markets. It is intended to chart the current and historical strength or weakness of a stock or market based on the closing prices of a recent trading period. The indicator should not be confused with relative strength .
What is Stochastic?
The stochastic oscillator, also known as stochastic indicator, is a popular trading indicator that is useful for predicting trend reversals. It also focuses on price momentum and can be used to identify overbought and oversold levels in shares, indices, currencies and many other investment assets.
What is Loxxer?
The Loxxer indicator is a technical analysis tool that compares the most recent maximum and minimum prices to the previous period's equivalent price to measure the demand of the underlying asset.
What is Velocity?
In simple words, velocity is the speed at which something moves in a particular direction. For example as the speed of a car travelling north on a highway, or the speed a rocket travels after launching.
How to use
Long signal: All 4 indicators turn green
Short signal: All 4 indicators turn red
Included
Bar coloring
Alerts

AntaresLibrary "Antares"
this library contains some utility functions that I use in my open source scripts including moving average helpers, candlstick helpers, money management, formatters, convertors, webhook integration, analysis, filters and drawing helpers
ma(type, length, source)
Wraps all ma functions
Parameters:
type : Either SMA or EMA or RMA or WMA or VWMA
length : Number of bars (length).
source : Series of values to process.
Returns: Moving average of `source` for `length` bars back by the of MA.
bb(ma, length, mult, source)
Overwrites `ta.bb` duo to limitations of simple int.float mult. Bollinger Bands. A Bollinger Band is a technical analysis tool defined by a set of lines plotted two standard deviations (positively and negatively) away from a simple moving average (SMA) of the security's price, but can be adjusted to user preferences.
Parameters:
ma : Either SMA or EMA or RMA or WMA or VWMA
length : Number of bars (length).
mult : Standard deviation factor.
source : Series of values to process.
Returns: Bollinger Bands.
atr(length, h, l, c)
Overwrites `ta.atr` duo to limitations of simple int length. Function atr (average true range) returns the RMA of true range. True range is max(high - low, abs(high - close ), abs(low - close )).
Parameters:
length : Number of bars (length).
h : High price high price.
l : low price.
c : Close price close price.
Returns: Average true range.
rsi(length, source)
Overwrites `ta.rsi` duo to limitations of simple int length. Relative strength index. It is calculated using the `ta.rma()` of upward and downward changes of `source` over the last `length` bars.
Parameters:
length : Number of bars (length).
source : Series of values to process.
Returns: Relative strength index.
lowest(length, source, start)
Lowest value for a given number of bars back.
Parameters:
length : Number of bars (length).
source : Series of values to process.
start : Series number of bars that should be skipped before process.
Returns: Lowest value in the series.
highest(length, source, start)
Highest value for a given number of bars back.
Parameters:
length : Number of bars (length).
source : Series of values to process.
start : Series number of bars that should be skipped before process.
Returns: Highest value in the series.
atr_multiplier(rsi, atr_max_multiplier)
Dynamic atr multiplier calculated by RSI.
Parameters:
rsi : Relative strength index.
atr_max_multiplier : The maximum multiplier of atr
Returns: Dynamic multiplier of ATR
offset(atr, atr_multiplier)
Safe dynamic offset you need to use in your stoploss, stop buy/sell, etc.
Parameters:
atr : Average true range.
atr_multiplier : ATR multiplier got from `atr_multiplier(rsi, atr_max_multiplier)`
Returns: Dynamic offset
rsi_emotional(rsi, bottom, top)
Tells you if RSI is in emotional zone.
Parameters:
rsi : Relative Strength Index
bottom : The zone that below it market reacts emotionally
top : The zone that above it market reacts emotionally
Returns: false if RSI was between `bottom` and `top` otherwise true
rsi_signal(rsi, bottom, top)
Tells you if RSI is in good point to check your other strategy conditions.
Parameters:
rsi : Relative Strength Index
bottom : The zone that below it market reacts emotionally
top : The zone that above it market reacts emotionally
Returns: 1 if RSI crossed out 30, 50 or 70. -1 if RSI crossed under 70, 50, 30. otherwise is 0
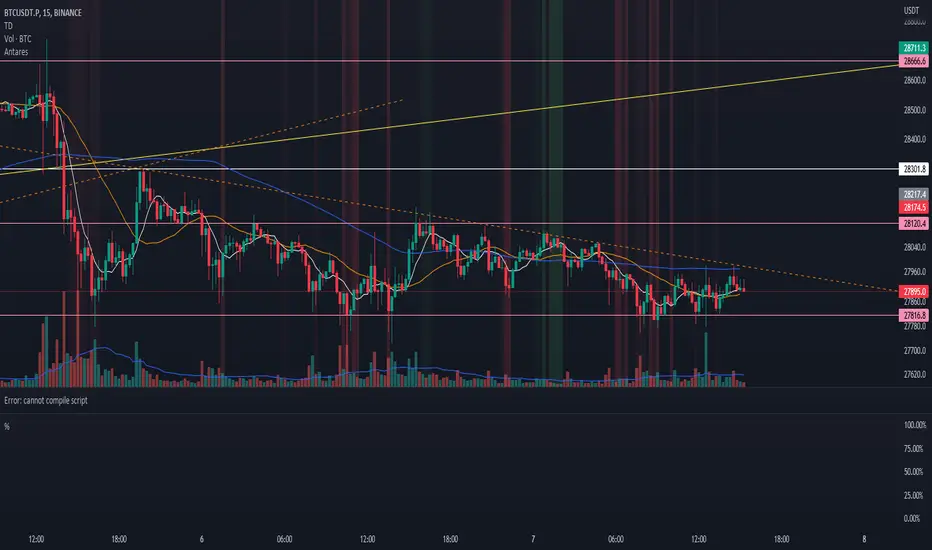
Global & local RSI / quantifytoolsAs the terms global and local imply, global RSI describes broad relative strength, whereas local RSI describes local relative strength within the broad moves. A macro and micro view of relative strength so to speak. Global and local RSI are simply regular RSI and stochastic RSI. Local RSI extremes ( stochastic RSI oversold/overbought) often mark a pivot in RSI which naturally reflects to price. Local RSI extremes are visualized inside the global RSI bands (upper band for overbought, lower band for oversold) in a "heat map" style.
By default:
Stochastic RSI >= 75 = yellow
Stochastic RSI >= 87 = orange
Stochastic RSI >= 100 = pink
Users also have the ability smooth the RSI with their preferred smoothing method ( SMA , EMA , HMA , RMA, WMA ) and length. This leads to different behavior in RSI, rendering the typical RSI extremes (> 70 or < 30) suboptimal or even useless. By enabling adaptive bands, the extremes are readjusted based on typical RSI pivot points (median pivots ), which gives much more relevant reference points for oversold/overbought conditions in both global and local RSI. This feature can be used without smoothing, but it rarely provides a meaningful difference, unless the RSI calculation length is messed with.
Global RSI can be plotted as candles, bars or a line. Candles and bars can be useful for detecting rejections (wicks) in relative strength, the same you would with OHLC data. Sometimes there are "hidden rejections" that are visible in relative strength but not on OHLC data, which naturally gives an advantage. All colors can be adjusted in the input menu. You also have a real-time view of the current RSI states in top right corner. Available alerts are the following: global RSI overbought, global RSI oversold, local RSI overbought and local RSI oversold.

Relative Bi-Directional Volatility RangeThe basic math behind this Indicator is very similar to the math behind the Relative Strength Index without using a standard deviation as used for the Relative Volatility Index. The Volatility Range is calculated by utilizing the highs and lows. However not in the same way as in the Relative Volatility Index. This approach leads to different values, but the overall result clearly reveals the intrinsic Volatility of the chart, so the user can be aware, when something fundamentally is going on behind the scenes. If the Volatility rises on positive and negative range (-100 to 100) it implies that something fundamental is changing.
An advantage of using this kind of calculation is the possibility of separating the data into positive (buy pressure) and negative (sell pressure) components. The bi-directional character shows a slightly overhang in one of the directions, which can be used to detect a trend. A Moving Average of the users choice shell smoothen the overhang of the Relative Bi-Directional Volatility and show a trend direction. Similar to the math of the Relative Strength Index as standard a Relative Moving Average is preferred. If the Moving Average is in the positive range (0 to 100) it indicates a bullish trend, else if the Moving Average is in the negative range (0 to -100) it indicates a bearish trend. External Indicators can use a provided Trend Shift Signal which switches from 0 to 1, if the trend becomes bullish or from 0 to -1, if the trend becomes bearish.
The user should know, that in this Indicator the starting point of the Moving Averages always begins at the first bar, because the starting progress is approximated appropriately. Most Moving Averages require a minimum number of bars to be calculated, which is chosen with the Moving Average Length. In this cases the length used will be automatically reduced in the background until the number of bars is sufficient to match the chosen length. So if data history is very short, the Indicator can be used never the less as good as possible.
It is feasible to switch the Indicator on a higher timeframe, while staying in a lower timeframe on the chart. This can be useful for making the indication cleaner, if the Moving Average is to choppy and shows too many false signals. On the other hand the benefit of a higher timeframe (or a higher Moving Average Length) is paid with higher latency of the signaling. So the user has to decide what the best setting in his case is.
This Indicator can be used with all kinds of charts. Even charts with percentage or negative values should work fine.

[blackcat] L2 James Garofallou RSI In 4 DimLevel 2
Background
Traders’ Tips of September 2020, the focus is James Garofallou’s article in the September issue, “Tracking Relative Strength In Four Dimensions”.
Function
In “Tracking Relative Strength In Four Dimensions” in this issue, author James Garofallou introduces us to a new method of measuring the relative strength of a security. This new technique creates a much broader reference than would be obtained by using a single security or index and combines several dimensions, as the author calls them, into a single rank value. This study compares a security to another in four dimensions, as explained in the article. James Garofallou presents a metric for a security’s strength relative to 11 major market sectors and over several time periods. All this is squeezed into a single value. The first step is the RS2. It normalizes the security to a market index, then calculates four moving averages and encodes their relations in a returned number. I just modified it by using most BTC-correlated instruments to reflect how BTC response to their performance.
Remarks
This is a Level 2 free and open source indicator.
Feedbacks are appreciated.
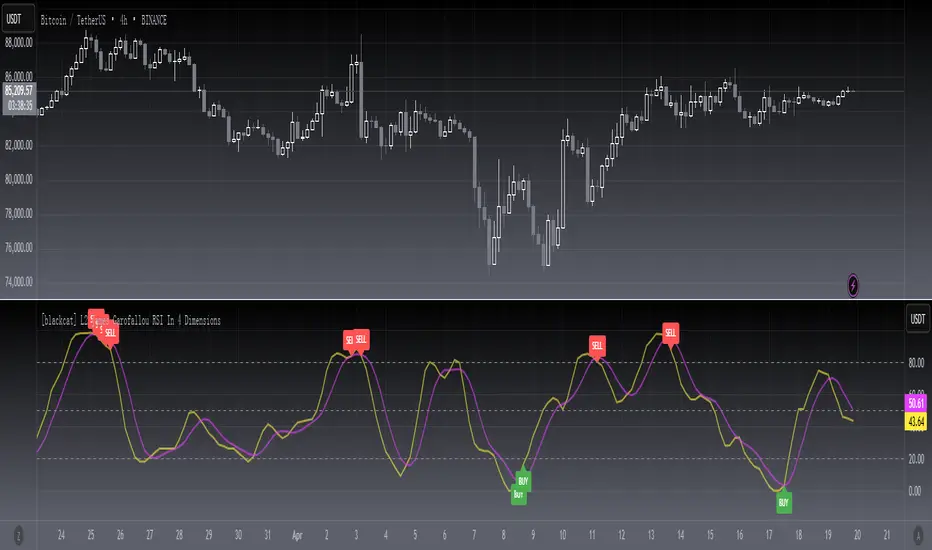
[blackcat] L1 Vitali Apirine RS EMALevel 1
Background
For Traders’ Tips for 2022.05, the focus is Vitali Apirine’s article in the January 2022 issue, “Relative Strength Moving Averages, Part 1: The Relative Strength Exponential Moving Average (RS EMA)”.
Function
Author Vitali Apirine introduces the relative strength exponential moving average (RS EMA). The study is designed to account for relative strength of price and is considered a trend-following indicator that can be used in combination with an EMA of the same length to identify the overall trend. RS EMAs with different lengths can define turning points and filter price movements.
Remarks
This is a Level 1 free and open source indicator.
Feedbacks are appreciated.

Alpha Relative Strength IndexA bullish signal on the RSI indicator signals that price did not move in sync with the RSI; price moved low, but the RSI moved less. This bullish divergence is an indication of strengthening momentum. A bearish signal on the RSI indicator signals that price and RSI are not in sync
